
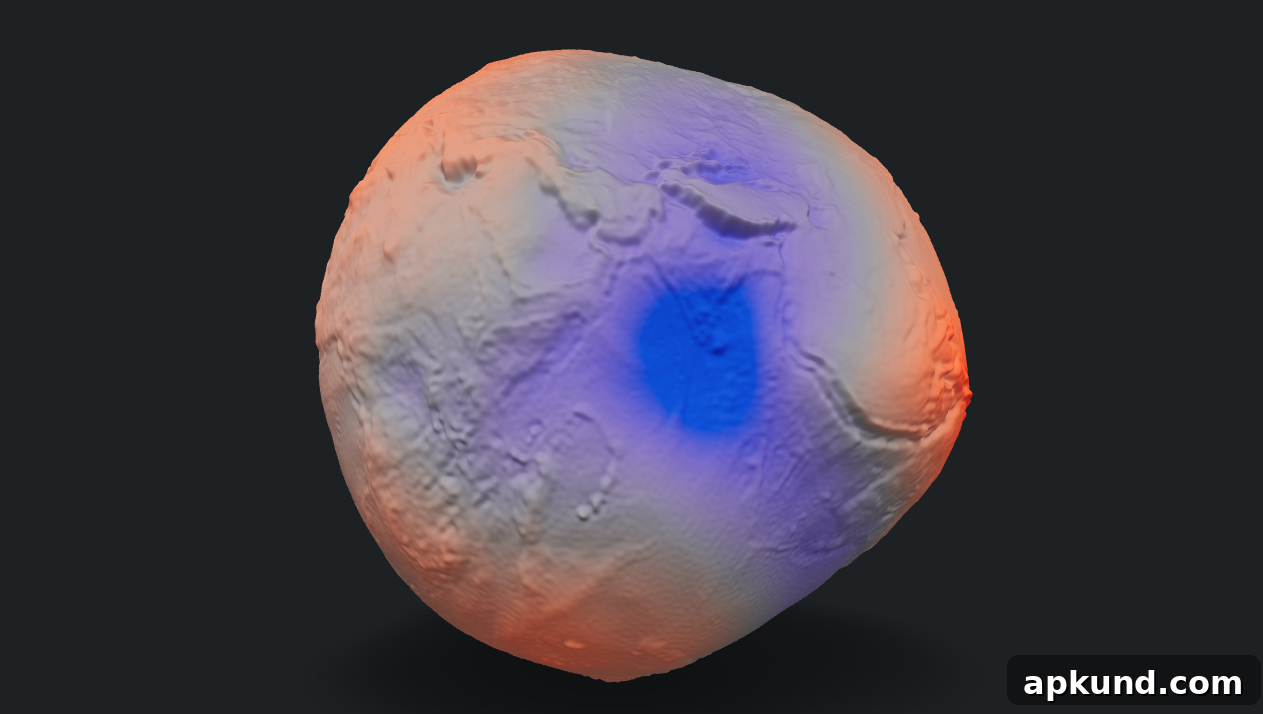
It turns out Earth is not a perfect sphere. NASA recently released a vivid demonstration that presents an interactive model of the geoid — the hypothetical shape the global ocean surface would assume under the influence of Earth’s gravity and rotation alone. This visualization helps explain how variations in the planet’s gravity field create subtle but measurable differences in sea level from place to place.
Gravity over Earth is uneven because mass is distributed irregularly beneath the surface: mountain ranges, ocean trenches, and density contrasts in the crust and mantle all change the local gravitational pull. Those variations cause the geoid to rise and fall relative to a simple mathematical ellipsoid. In NASA’s demonstration, those height differences are emphasized: the agency amplifies the geoid’s deviations by a factor of 10,000 to make the subtle variations easier to see. In real terms, the geoid’s height varies by tens to a little over a hundred meters — for example, a peak of roughly 85 meters near Iceland and a low of about −106 meters off the coast of southern India — but these differences become far more visible when exaggerated for educational and analytical purposes.
An Instagram post shared by Observatory is embedded in the original report to illustrate public interest in the geoid visualization. The embedded post highlights the same NASA animation and offers a short visual complement to the interactive model. (Embedded media removed for a cleaner, script-free presentation.)View the original Instagram post on Instagram
The geoid map shown by NASA is based on a comprehensive gravity dataset called the GOCO06s gravity field model. GOCO06s is a combined, satellite-derived gravity model compiled by the Gravity Observation Combination project. It integrates more than a billion gravity measurements collected over approximately 15 years from a fleet of 19 satellites. That data set includes observations from NASA’s Gravity Recovery and Climate Experiment (GRACE) mission and the European Space Agency’s Gravity field and steady-state Ocean Circulation Explorer (GOCE), among others. By combining long-term, high-precision satellite observations, the model resolves fine-scale variations in the gravity field that ground-based measurements alone cannot provide.
The resulting geoid is a powerful scientific tool. It offers an accurate reference surface for oceanography, geodesy, and climate research. Oceanographers use geoid information to separate dynamic ocean topography — the height of the sea surface caused by currents, temperature, and salinity differences — from gravity-driven variations. Geodesists and surveyors rely on geoid models to convert between geometric heights determined by GPS and the mean sea level used in mapping and engineering. The geoid also helps researchers monitor mass redistribution within the Earth system, such as ice loss from Greenland and Antarctica, changes in terrestrial water storage, and large-scale tectonic processes.
Although the geoid’s shape does not change how Earth appears in satellite imagery — photos and video still show the familiar round planet with clouds, continents, and oceans — the model provides a revealing perspective on how gravity influences the world’s water. Where the geoid rises, the ocean surface would be relatively higher if only gravity and rotation were at work; where it dips, the surface would be relatively lower. Those differences are usually masked by winds, currents, and tides, yet they are measurable and meaningful for precise scientific work.
For readers interested in exploring the visualization directly, NASA’s interactive 3D geoid model gives an accessible way to inspect regional variations and learn more about the underlying data and missions. The interactive display also offers explanatory context for the GOCO06s model, the satellites that contributed to it, and the scientific relevance of geoid mapping for oceanography, climate studies, and geodesy.